.png)
Creating A Cincinnati City Employee Dashboard Using SQL And Tableau
This project is creating SQL queries and a Tableau visualization to analyze and showcase the pay and demographics of people that work for the city of Cincinnati.

“It is a capital mistake to theorize before one has data.”
This project is creating SQL queries and a Tableau visualization to analyze and showcase the pay and demographics of people that work for the city of Cincinnati.
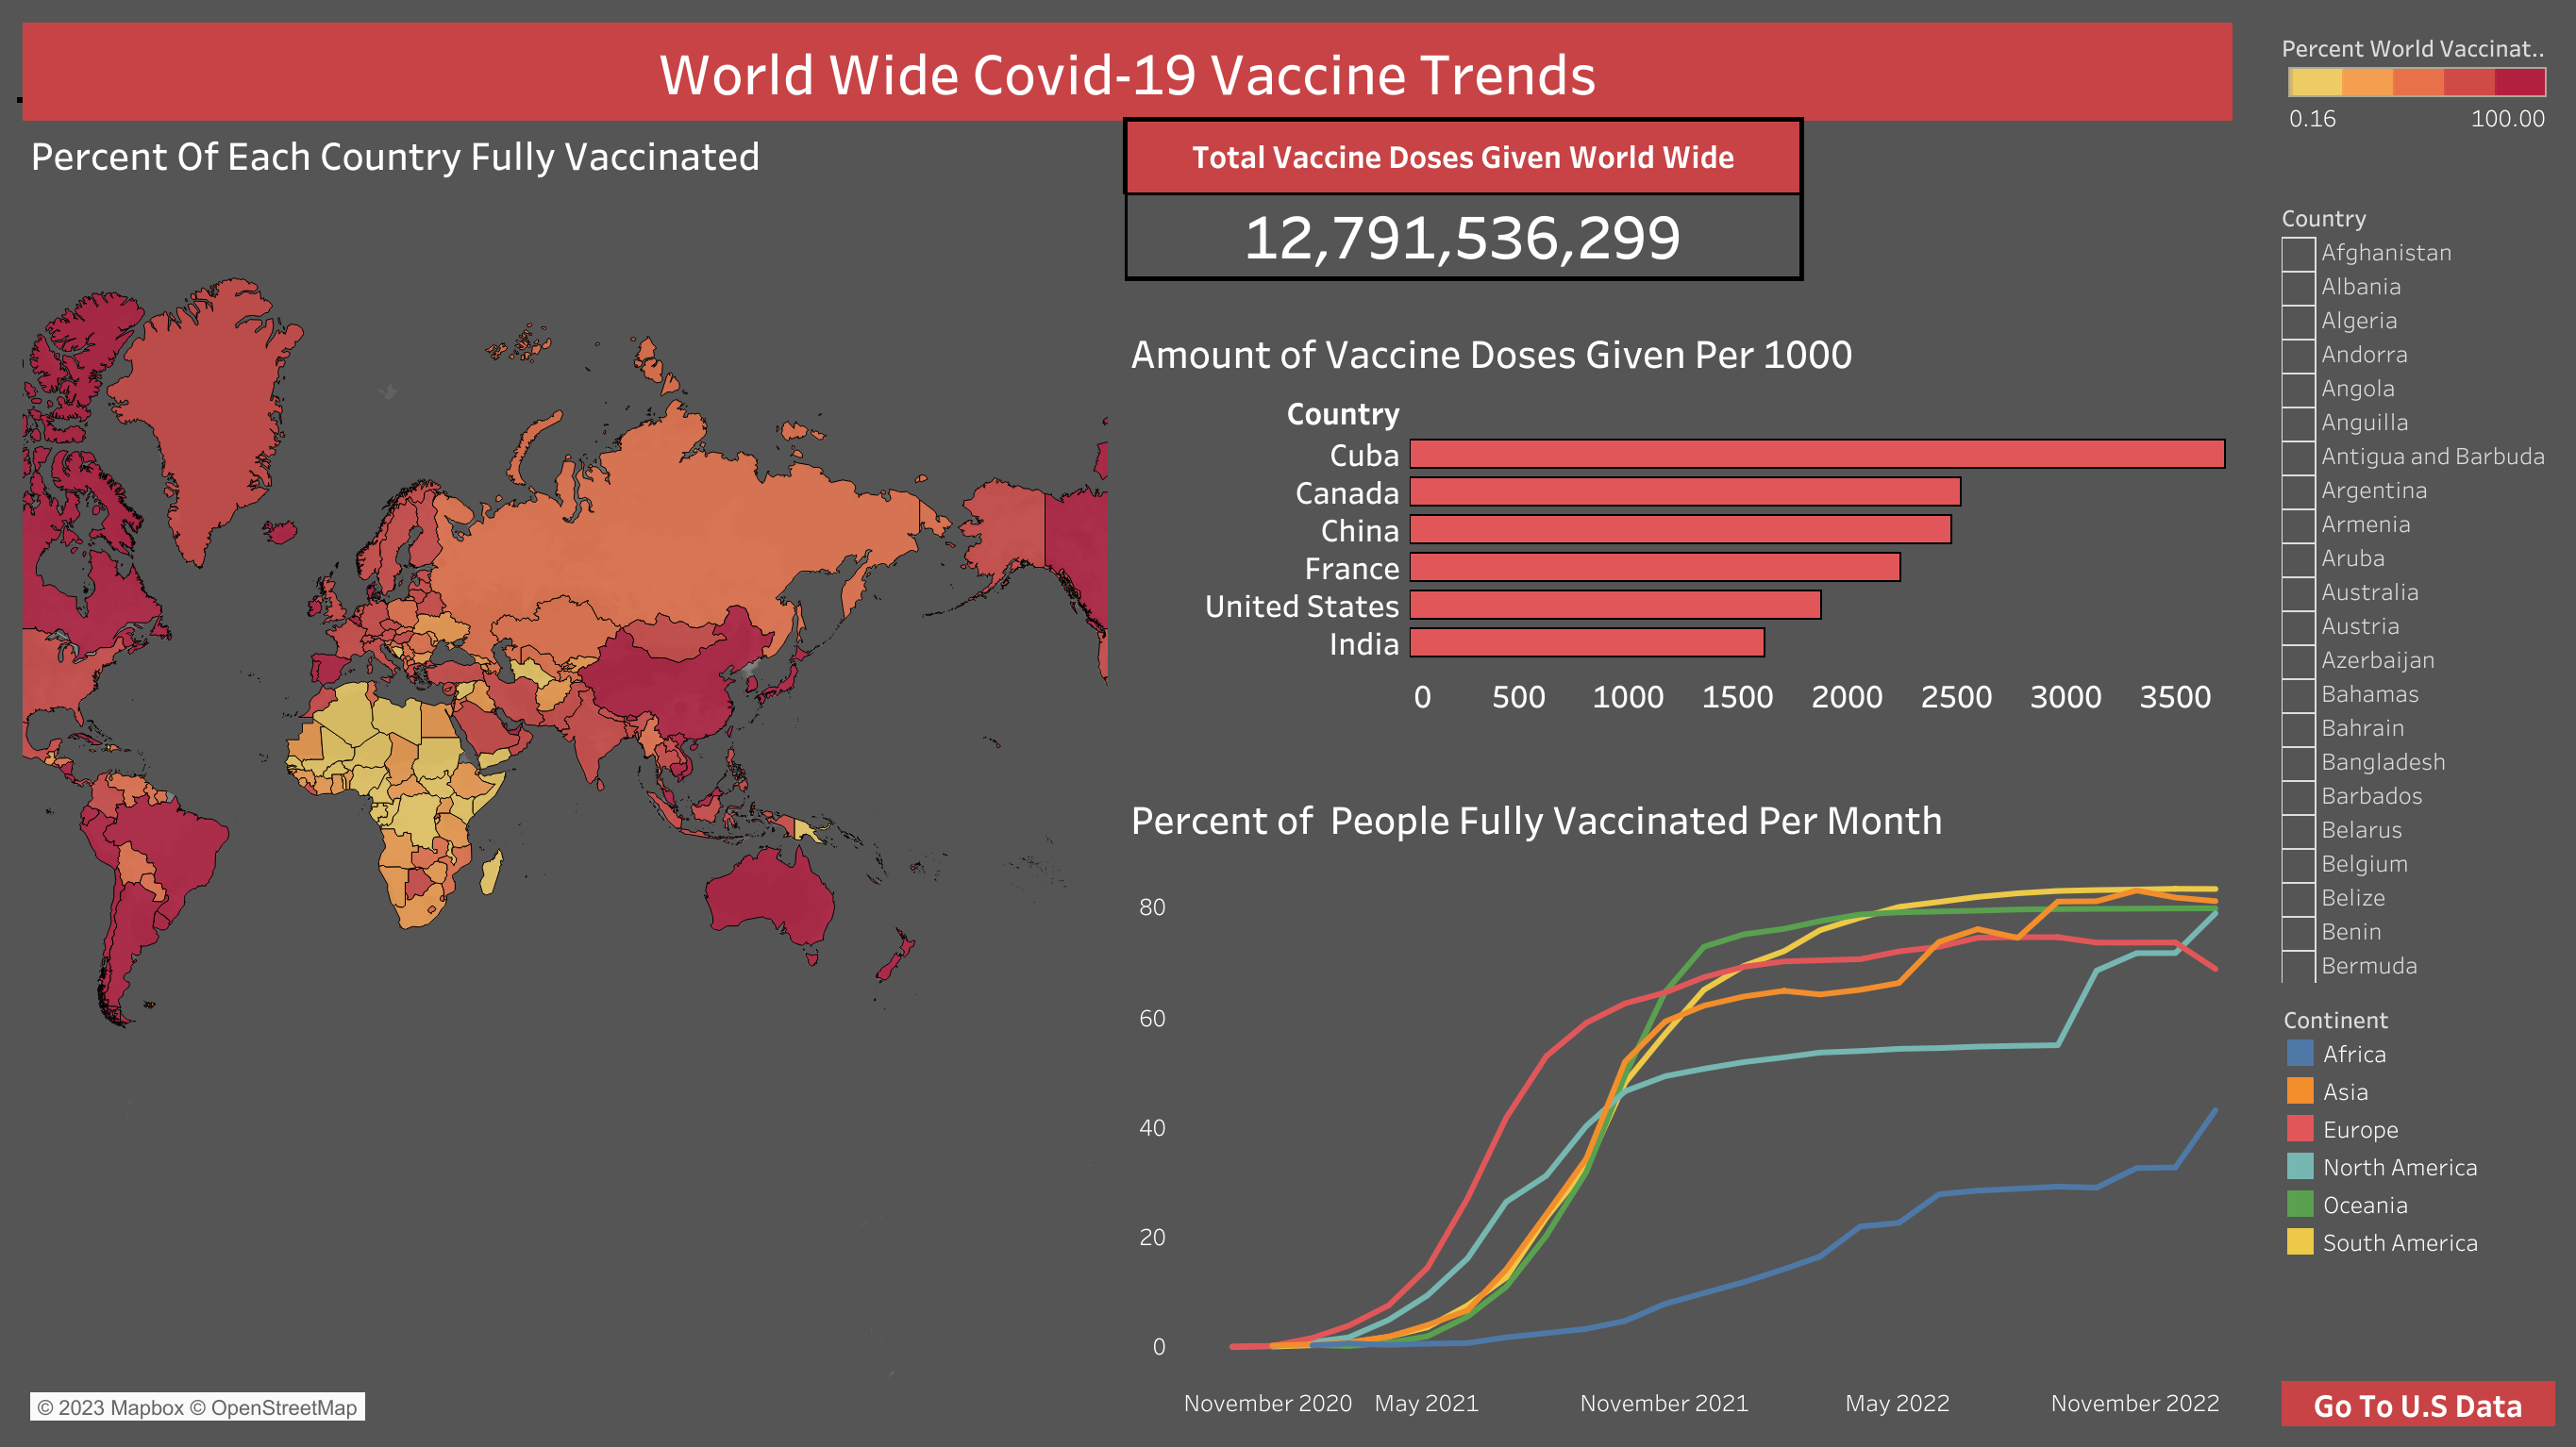
This project is using SQL queries and Tableau visualizations to show the recent trends in Covid-19 vaccine data.