Interactive Dashboard In Tableau Using SQL Queries
Motivation
As a psychology major, substance use disorder and how that continues to affect the United States has always been extremely fascinating to me. After finding the dataset on Connecticut overdoses from the years 2012 - 2018 while scrolling through Kaggle.com, I couldn't help but throw it into SQL server and Tableau and try to discover some findings that would help myself and hopefully, others better understand this epidemic that is affecting a lot of people.
Queries in SQL
The average age of overdoses
SELECT ROUND(AVG(Age)) AS Average_Age_ODFROM drug_Death.DrugDeathCT;The number of overdoses from 2012-2018
SELECT COUNT(DISTINCT ID) AS Number_Of_OverdosesFROM drug_Death.DrugDeathCT;The number of overdoses in each Connecticut city
SELECT COUNT(DISTINCT ID) AS OverdoseByCity, DeathCityFROM drug_Death.DrugDeathCTGROUP BY DeathCityORDER BY OverdoseByCity DESC;The top 5 drugs causing the most overdoses
--HeroinSELECT COUNT(Heroin) AS ODs_By_Heroin FROM drug_Death.DrugDeathCTWHERE Heroin = 1;--CocaineSELECT COUNT(Cocaine) AS ODs_By_Cocaine, FROM drug_Death.DrugDeathCTWHERE Cocaine = 1;--FentanylSELECT COUNT(*) AS ODs_By_Fentanyl FROM drug_Death.DrugDeathCTWHERE Fentanyl_Analogue = 1;--OxycodoneSELECT COUNT(*) AS ODs_By_Oxycodone FROM drug_Death.DrugDeathCTWHERE Oxycodone = 1;--OxymorphoneSELECT COUNT(*) AS ODs_By_Oxymorphone FROM drug_Death.DrugDeathCTWHERE Oxymorphone = 1;--AlcoholSELECT COUNT(*) AS ODs_By_Alcohol FROM drug_Death.DrugDeathCTWHERE Ethanol = 1;--HydrocodoneSELECT COUNT(*) AS ODs_By_Hydrocodone FROM drug_Death.DrugDeathCTWHERE Hydrocodone = 1;--BenzodiazepineSELECT COUNT(*) AS ODs_By_Benzodiazepines FROM drug_Death.DrugDeathCTWHERE Benzodiazepine = 1;--MethadoneSELECT COUNT(*) AS ODs_By_Methadone FROM drug_Death.DrugDeathCTWHERE Methadone= 1;The number of overdoses by each race
SELECT COUNT(DISTINCT ID) AS OverdoseByRace, Count(Race), RaceFROM drug_Death.DrugDeathCTWHERE Race is not nullGROUP BY RaceORDER BY OverdoseByRace DESC;Findings
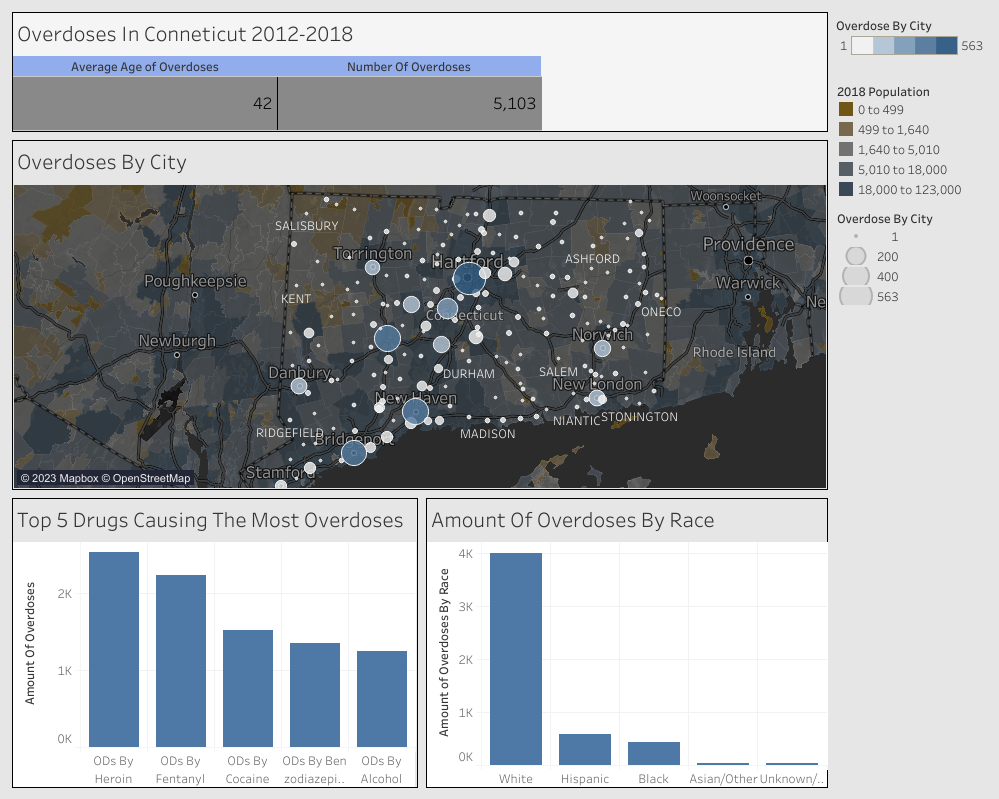
After writing these queries, running them, and analyzing the results, we can state the findings which can be seen in the Tableau dashboard at the top of the page or here (this link will take you to the tableau dashboard where the interactive map can be used). The main findings were that the average age of overdoses in the state of Connecticut was 42 years old, 5,103 overdoses had occurred, the city of Hartford had the most overdoses by about 200, heroin caused the most overdoses with fentanyl being a close second, and white people were far more likely to overdose in the state of Connecticut than any other race.
Actions
Now that the data has been cleaned, explored, and analyzed the most important part is to take action on these findings. What a stakeholder could do is use these statistics to create programs that try to lessen drug use in the communities that are most affected, like middle-aged white individuals.
.png)